Plot for each eigenSpline the automatically fitted spline, splines for all df and a spline at a chosen df
Source:R/df_search.R
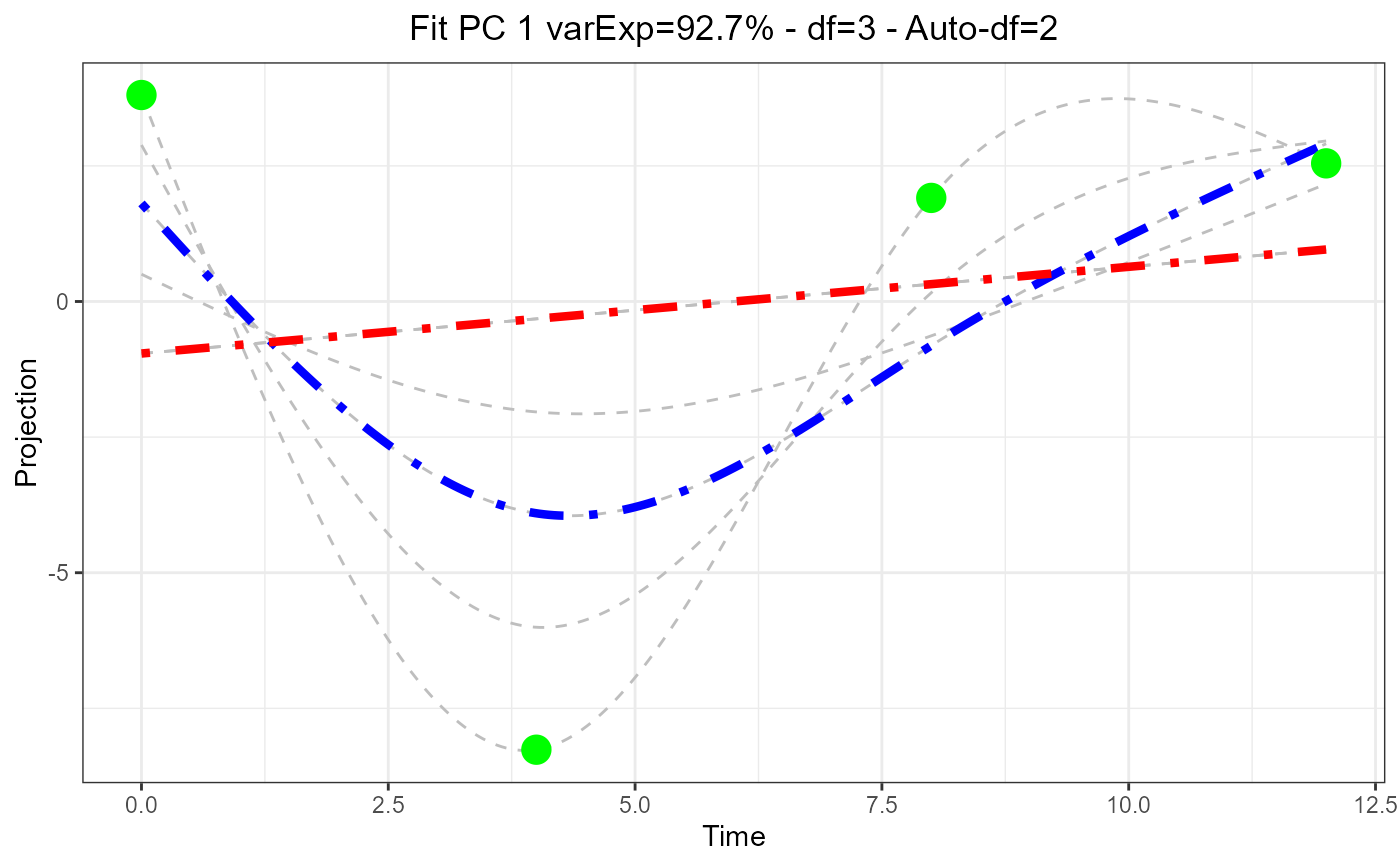
get_eigen_DFoverlay_list.RdPlot for each eigenSpline the automatically fitted spline (red), splines for all possible df (grey) and a spline at a manually chosen df (blue).
Usage
get_eigen_DFoverlay_list(
  eigen,
  manualDf = 5,
  nPC = NA,
  step = NA,
  showPt = TRUE,
  autofit = TRUE
)
Arguments
- eigen
A list of eigenSpline parameters as generated by
get_eigen_spline, containingeigen$matrix,eigen$variance,eigen$modelandeigen$countTP.- manualDf
(int) A manually selected df. Default is 5.
- nPC
(int) The first n eigenSplines to plot. Default is NA, plot all eigenSplines.
- step
(float) The df increment employed to plot splines over the range of df.
- showPt
(bool) If True the eigenSpline data points are plotted. Default is TRUE.
- autofit
(bool) If True the automatically fitted splines (using CV) are plotted. Default is TRUE.
Value
A list of ggplot2 plotObjects, one plot per eigenSpline. All results can be plotted using do.call(grid.arrange, returnedResult).
See also
Graphical implementation with santaR_start_GUI
Other DFsearch:
get_eigen_DF(),
get_eigen_spline(),
get_param_evolution(),
plot_nbTP_histogram(),
plot_param_evolution()
Examples
## 8 subjects, 4 time-points, 3 variables
inputData  <- acuteInflammation$data[0:32,1:3]
ind        <- acuteInflammation$meta$ind[0:32]
time       <- acuteInflammation$meta$time[0:32]
eigen      <- get_eigen_spline(inputData, ind, time, nPC=NA, scaling="scaling_UV",
                               method="nipals", verbose=TRUE, centering=TRUE, ncores=0)
#> nipals calculated PCA
#> Importance of component(s):
#>                  PC1     PC2      PC3
#> R2            0.9272 0.06606 0.006756
#> Cumulative R2 0.9272 0.99324 1.000000
#> total time: 0.07 secs
paramSpace <- get_param_evolution(eigen, step=1)
plotList   <- get_eigen_DFoverlay_list(eigen,manualDf=3,step=0.5,showPt=TRUE,autofit=TRUE)
plotList[1]
#> [[1]]

#>
# do.call(grid.arrange, plotList)
#>
# do.call(grid.arrange, plotList)