Getting Started with the santaR package
Arnaud Wolfer
2019-10-03
Source:vignettes/getting-started.Rmd
getting-started.RmdInteractive package for Short AsyNchronous Time-series
Analysis (SANTA), implemented in R and
Shiny
Overview
Longitudinal studies in Systems Biology face multiple challenges that are not suitably addressed by current time-series statistical methods, it is difficult to simultaneously account for with a high number of variables:
- biological variability
- measurement error
- missing observations
- asynchronous sampling
- nonlinearity
- low number of time points (e.g. 4-10)
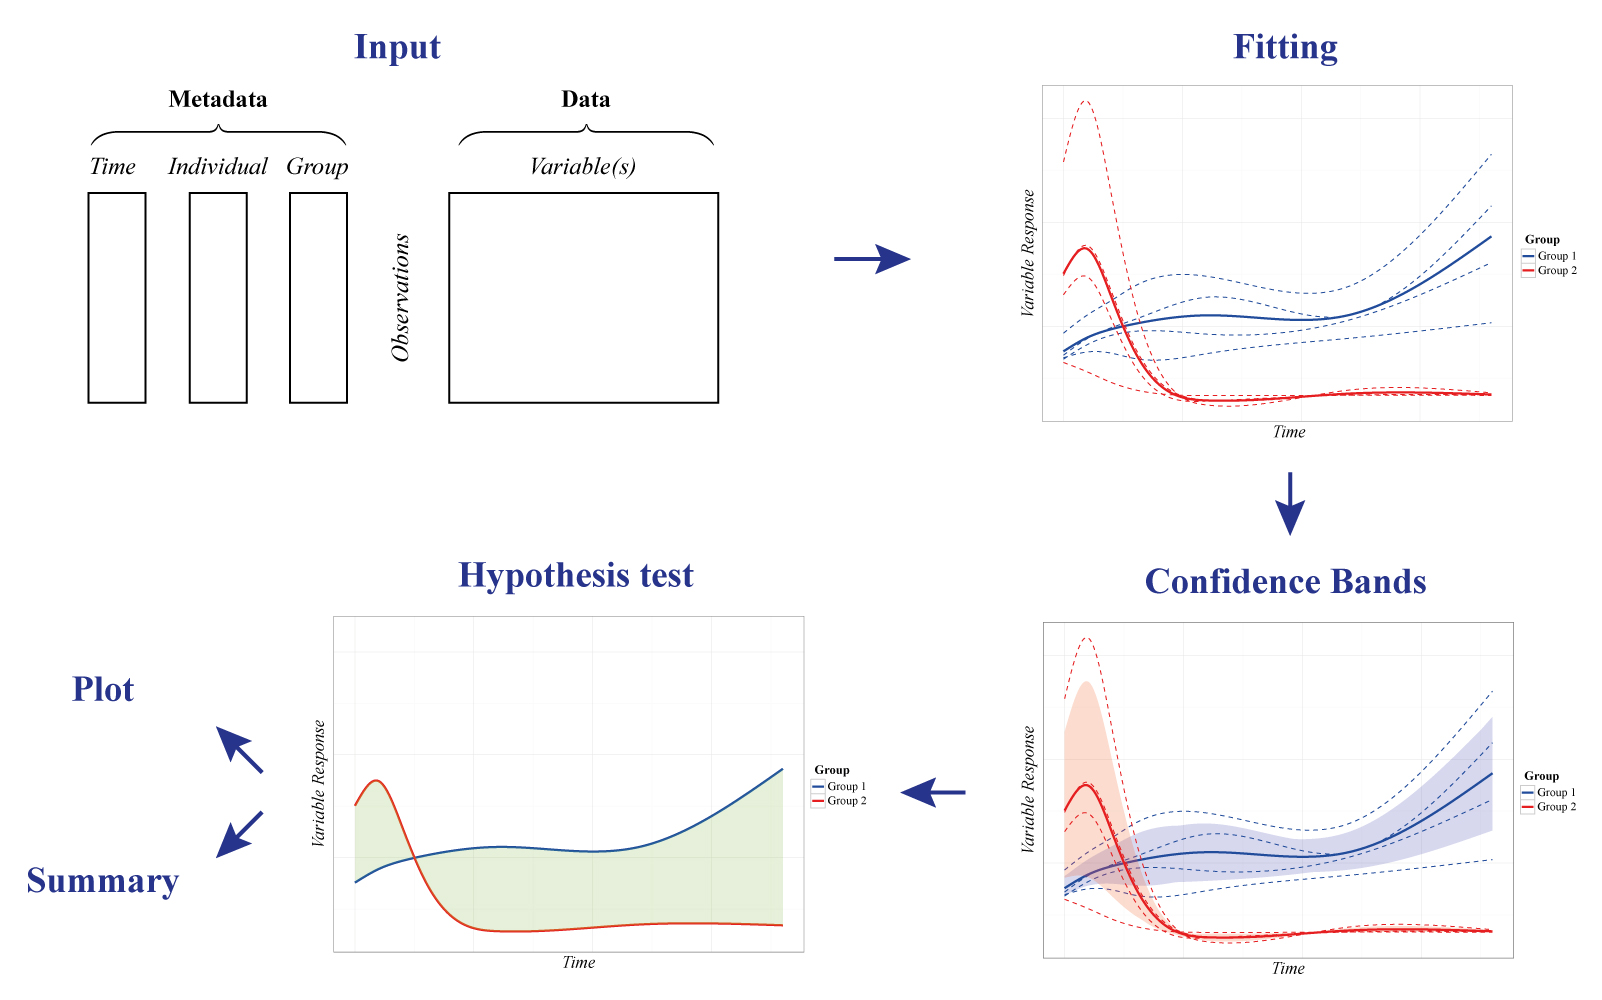
To address these challenges, santaR (Short
AsyNchronous Time-series Analysis) provides a Functional Data
Analysis (FDA) approach -where the fundamental units of
analysis are curves representing each individual across time-, in a
graphical and automated pipeline for robust analysis of short
time-series studies.
Analytes levels are descriptive of the underlying biological state and evolve smoothly through time. For a single analyte, the time trajectory of each individual is described with a smooth curve estimated by smoothing splines. For a group of individuals, a curve representing the group mean trajectory is also calculated. These individual and group mean curves become the new observational unit for subsequent data analysis, that is, the estimation of the intra-class variability and the identification of trajectories significantly altered between groups.
Designed initially for metabolomic, santaR is also
suited for other Systems Biology disciplines. Implemented in
R and Shiny, santaR is developed
as a complete and easy-to-use statistical software package, which
enables command line and GUI analysis, with fast and parallel automated
analysis and reporting. Comprehensive plotting options as well as
automated summaries allow clear identification of significantly altered
analytes for non-specialist users.

Getting Started
To get started santaR’s graphical user interface
implements all the functions for short asynchronous time-series
analysis:
library(santaR)

santaR_start_GUI(browser = TRUE)
#  To exit press ESC in the command line
The GUI is to be prefered to understand the methodology, select the best parameters on a subset of the data before running the command line, or to visually explore results.
If a very high number of variables is to be processed,
santaR’s command line functions are more efficient, as they
can be integrated in scripts and the reporting automated.