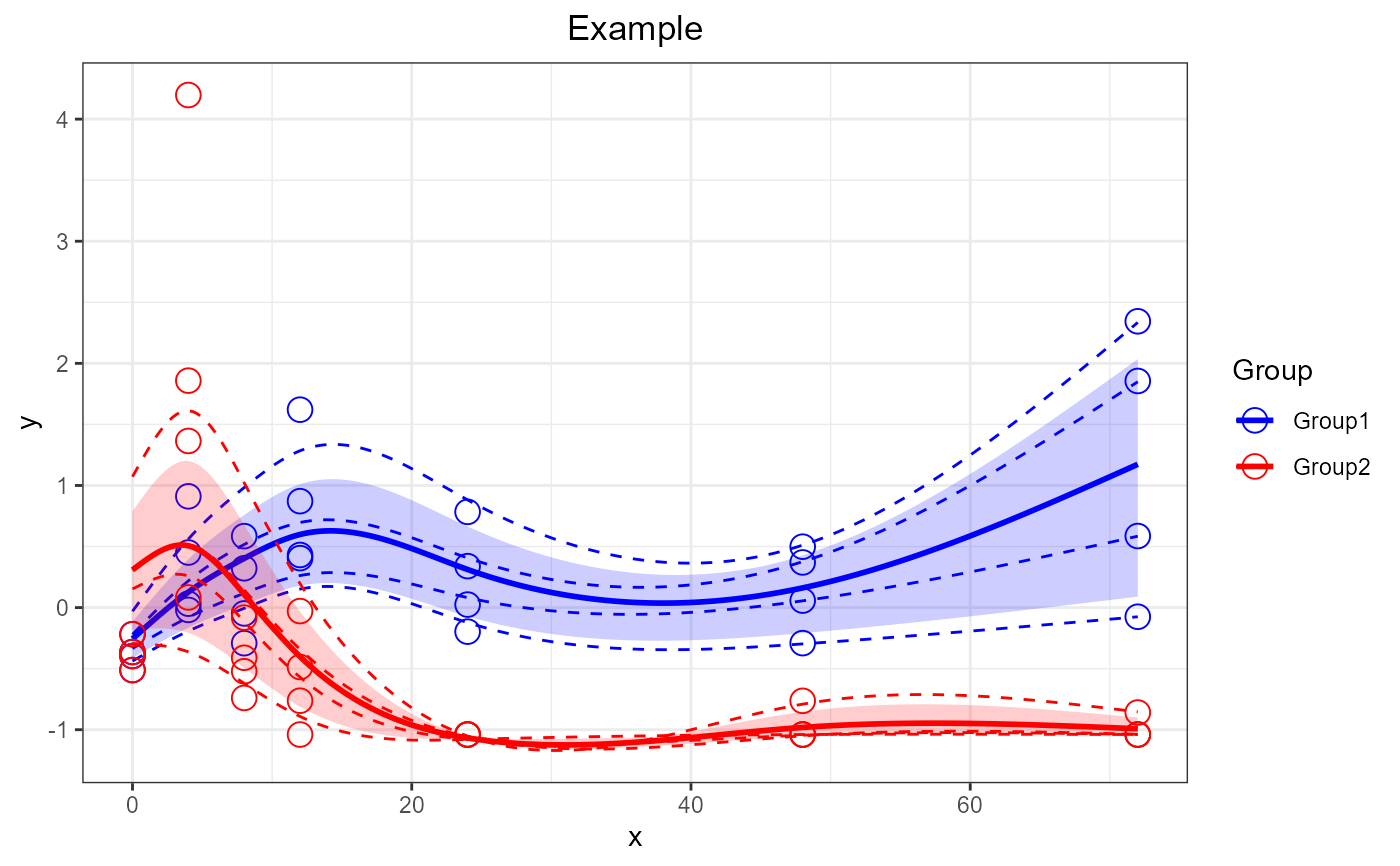
Plot a SANTAObj generated by santaR_fit. Returns a ggplot2 plotObject that can be further modified using ggplot2 grammar.
Usage
santaR_plot(
  SANTAObj,
  title = "",
  legend = TRUE,
  showIndPoint = TRUE,
  showIndCurve = TRUE,
  showGroupMeanCurve = TRUE,
  showTotalMeanCurve = FALSE,
  showConfBand = TRUE,
  colorVect = NA,
  sampling = 250,
  xlab = "x",
  ylab = "y",
  shortInd = FALSE
)
Arguments
- SANTAObj
A fitted SANTAObj as generated by
santaR_fit.- title
(str) A plot title. The default title is empty.
- legend
(bool) If TRUE a legend panel is added to the right. Default is TRUE. Note: the legend cannot be generated if only the Confidence Bands or the Total Mean Curve are plotted.
- showIndPoint
(bool) If TRUE plot each input measurements (in group color). Default is TRUE.
- showIndCurve
(bool) If TRUE plot each individual's curve (in group color). Default is TRUE.
- showGroupMeanCurve
(bool) If TRUE plot the mean curve for each group (in group color). Default is TRUE.
- showTotalMeanCurve
(bool) If TRUE plot the mean curve across all measurements and groups (in grey). Default is FALSE.
- showConfBand
If TRUE plot the confidence bands calculated with
santaR_CBand.- colorVect
Vector of
ggplot2colors. The number of colors must match the number of groups (ex:colorVect=c("deepskyblue","red")).- sampling
(int) Number of data points to use when plotting each spline (sub-sampling). Default is 250.
- xlab
(str) x-axis label. Default is 'x'.
- ylab
(str) y-axis label. Default is 'y'.
- shortInd
if TRUE individual trajectories are only plotted on the range on which they are defined. Default is FALSE.
See also
Other Analysis:
get_grouping(),
get_ind_time_matrix(),
santaR_CBand(),
santaR_auto_fit(),
santaR_auto_summary(),
santaR_fit(),
santaR_pvalue_dist(),
santaR_pvalue_fit(),
santaR_start_GUI()
Other AutoProcess:
santaR_auto_fit(),
santaR_auto_summary(),
santaR_start_GUI()
Examples
## 56 measurements, 8 subjects, 7 unique time-points
Yi          <- acuteInflammation$data$var_3
ind         <- acuteInflammation$meta$ind
time        <- acuteInflammation$meta$time
group       <- acuteInflammation$meta$group
grouping    <- get_grouping(ind, group)
inputMatrix <- get_ind_time_matrix(Yi, ind, time)
SANTAObj    <- santaR_fit(inputMatrix, df=5, grouping=grouping, verbose=TRUE)
SANTAObj    <- santaR_CBand(SANTAObj, nBoot=100)
p           <- santaR_plot(SANTAObj, title='Example')
print(p)
